Understanding the current state
More than just the numbers
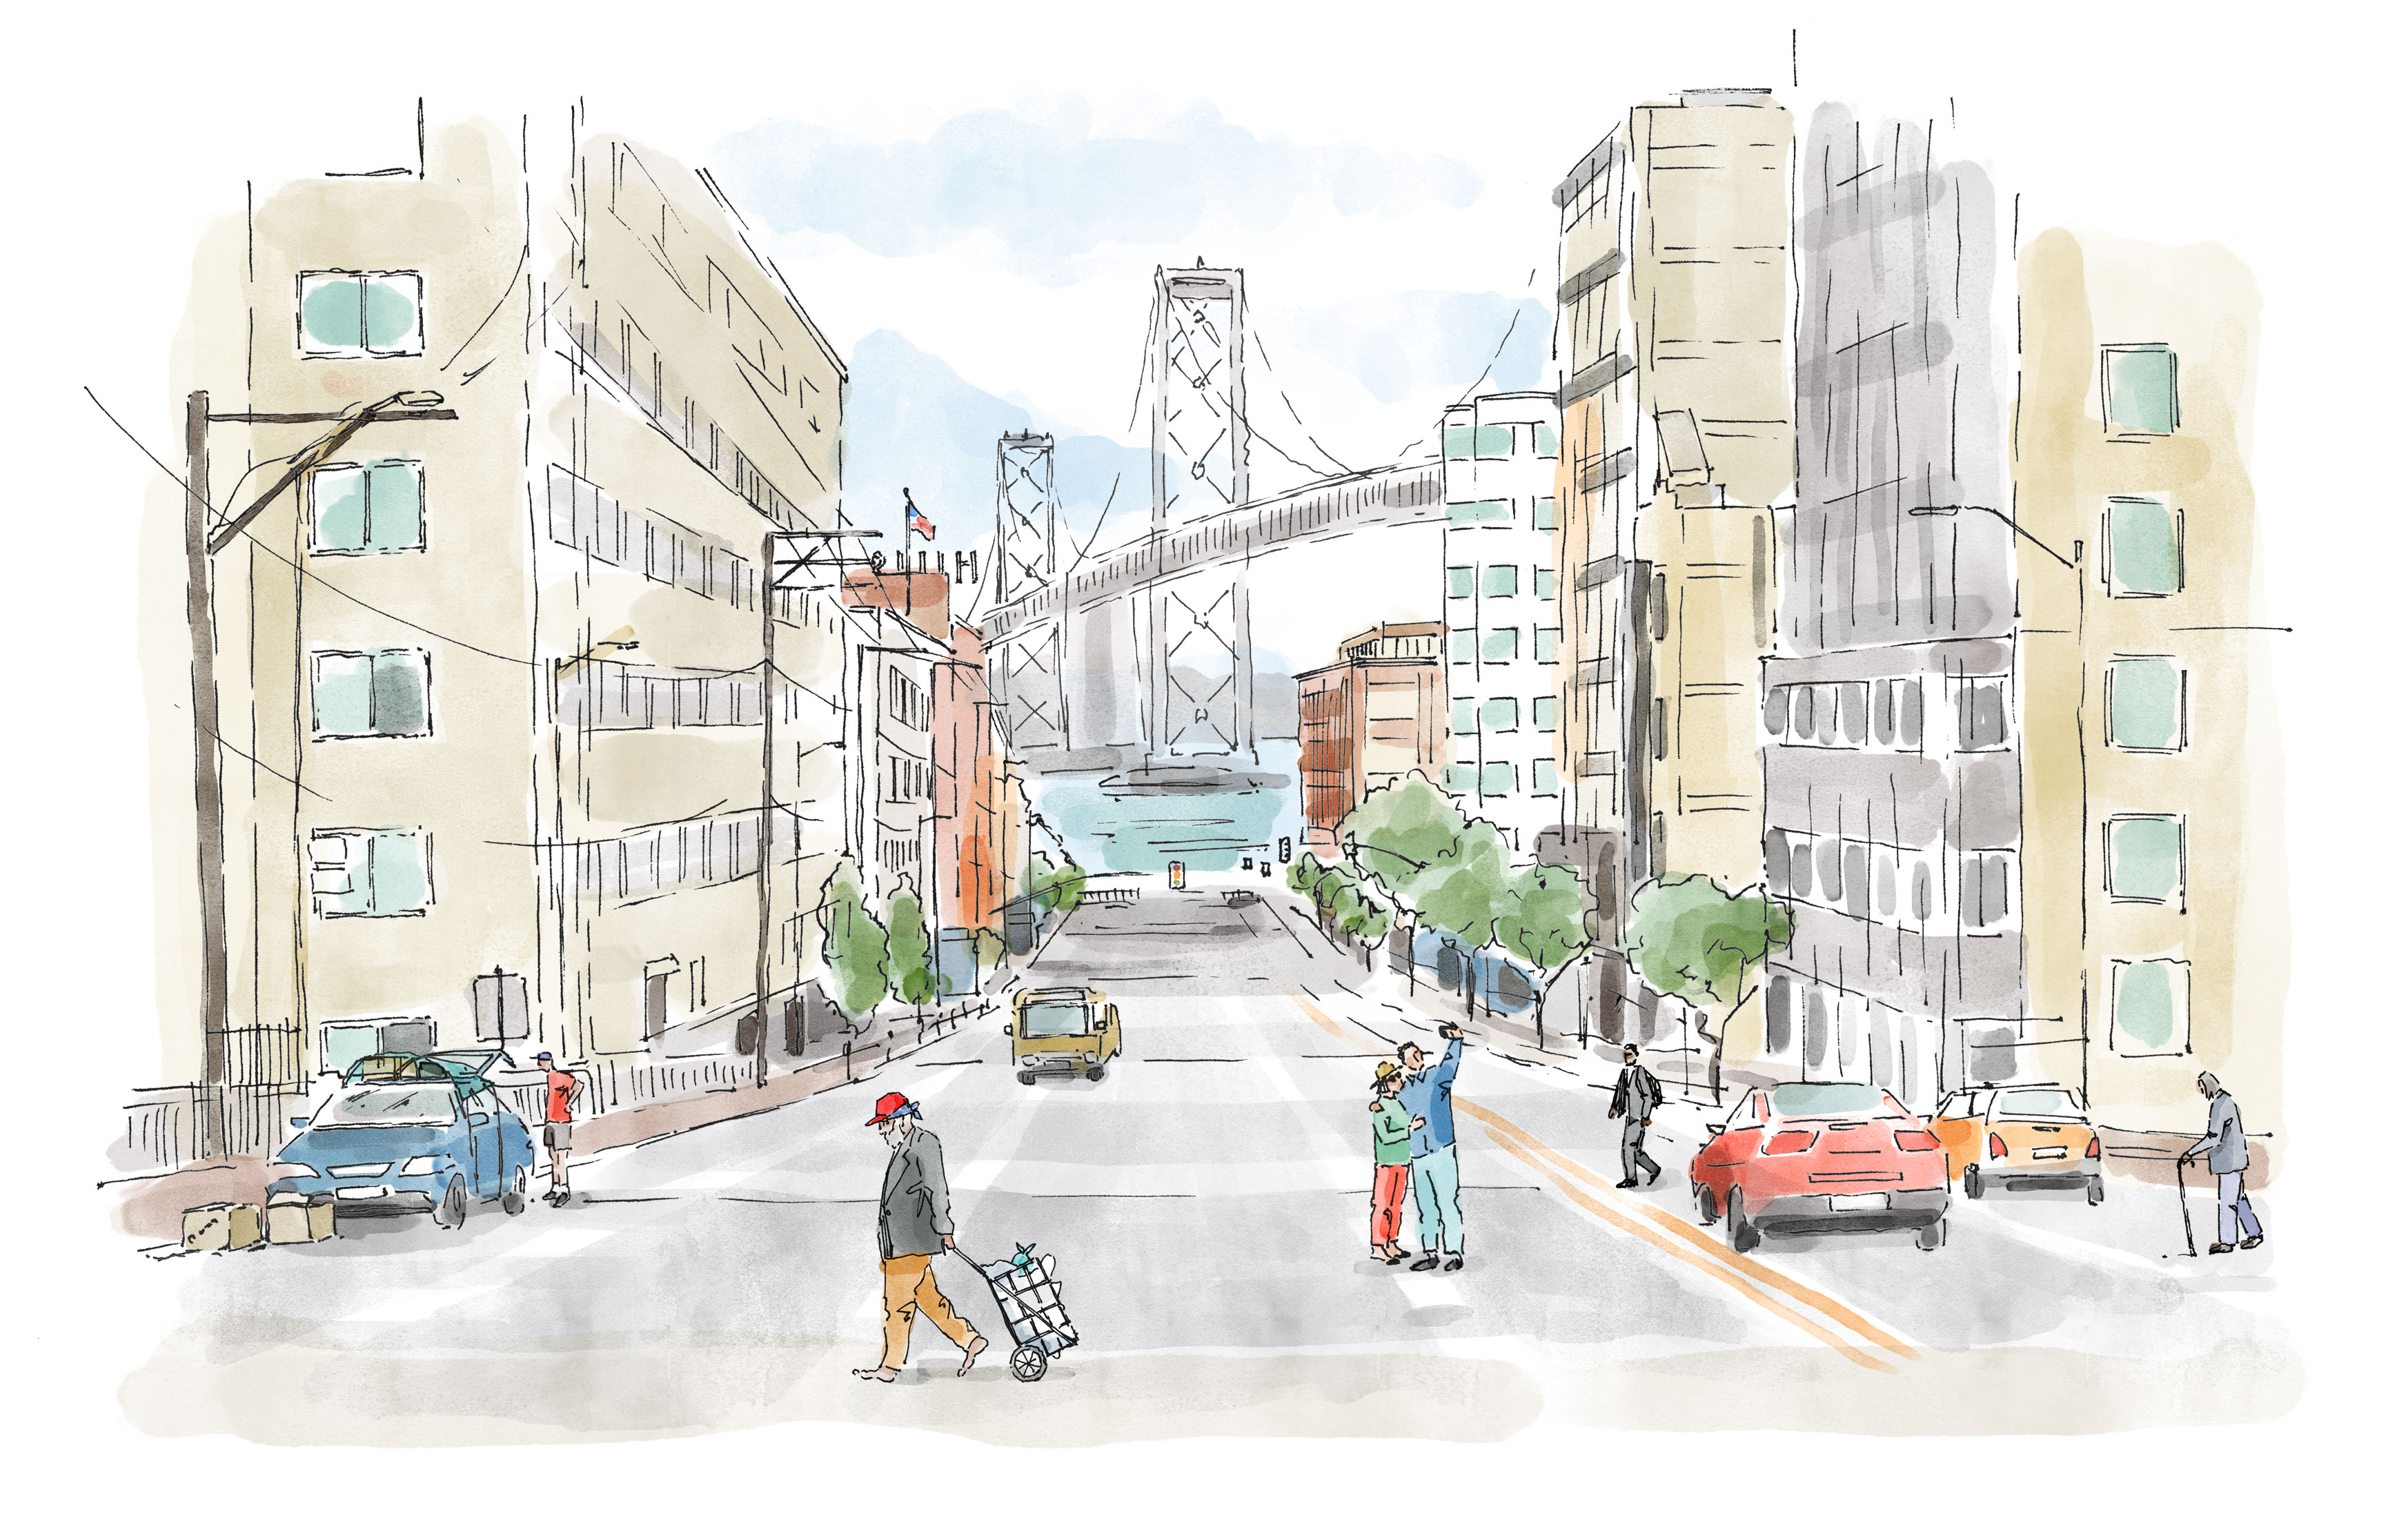
While many cities across the country and state are grappling with the challenge of homelessness, San Francisco and the surrounding Bay Area are facing the issue at a unique scale, under intense scrutiny. As one of the epicenters of California’s homelessness crisis, San Francisco has about 8,300 unhoused people—about 1% of the City’s population—every night, according to the City’s 2024 point-in-time count.14 Underlining the gravity of the issue, the homeless population has increased 7% since 2022.15
Certain segments of the population have been disproportionately affected. Despite making up only 5% of San Francisco's population, Black individuals represent 37% of the City’s homeless population.16 Additionally, families have seen a 94% increase in homelessness since 2019, reflecting how difficult it is for them to find shelter and support. This rise signals deeper issues, including a lack of family-focused services. While the point-in-time count provides a snapshot, it underestimates the true scale of the problem. The City estimates that as many as 20,000 people circulate in and out of homelessness over the course of a year—or two out of every 80 inhabitants of San Francisco.
San Francisco shelters about 48% of its unhoused population—lower than the statewide average of 68% but higher than the national average of 39%.17 San Francisco has also reduced unsheltered homelessness by 1% since 2022 and by 16% since 2019, demonstrating some success in getting people housed. However, the 1% drop, though positive, remains modest. During the same period, the Department of Homelessness and Supportive Housing’s (HSH) budget increased by over $160 million, suggesting more dramatic results should have been possible. To make a meaningful impact, the City must aim for larger reductions in unsheltered homelessness.
Bureaucratic bottlenecks must be unblocked. San Francisco is plagued by delays in affordable housing development, inefficiencies in service delivery, and poor coordination among City agencies. Tackling these bottlenecks—whether speeding up housing construction, improving how services are delivered, or ensuring better collaboration across agencies—will be crucial for making headway.
This graphic shows the dynamic flow of people entering and exiting homelessness to better express the scale of homelessness in San Francisco.18 The individual lines show the different pathways and their proportional scale of journeys from being at risk to entering to experiencing to exiting homelessness. For every person who finds a roof, others lose theirs. Many people cycle in and out of homelessness, edging toward a lifetime on the streets, and a subset of these individuals require more intensive support. This analysis highlights the different reasons for homelessness and the different ways in which people exit or reenter homelessness. It also identifies points for intervention where timely action could significantly improve a person’s prospects.
Definitions/assumptions
- At-risk population. Individuals at risk of entering homelessness, categorized as extremely low income (ELI), earning less than 30% of the area median income
- At-risk economic. Individuals who are at risk of entering homelessness primarily for economic reasons, such as income level
- Entry into non-chronic homelessness plus prior-year chronic/non-chronic. Assumed to be the number of individuals experiencing homelessness each year, or 20,000 in San Francisco in 2024
- Chronic homelessness. Having a disabling condition and having been unhoused more than one year or at least 12 months over four times in three years; in 2024, estimated at 36% of people experiencing homelessness in San Francisco
- Breakdown of non-chronic homelessness. Self-identified primary event/condition for entering homelessness; can be economic, health, social, or other
- Exits. Government programs (rapid rehousing, problem solving, and permanent supportive housing, including scattered sites), assuming permanent supportive housing units are fully reserved for chronically unhoused individuals
- Problem solving. Includes relocation assistance, financial assistance, and other interventions to divert or rapidly exit people from homelessness
- Precariously housed. Not placed in City programs or not continuing to experience homelessness
- Next-year chronic. Calculation based on assumption of streamlined reduction of approximately 200 individuals per year
- Economic drivers. Primary economic events or conditions that led to a person’s homelessness (for example, job loss, eviction, raised rent, foreclosure)
- Health drivers. Substance abuse, mental illness, medical conditions, hospitalization/treatment contributing to homelessness
- Social drivers. Incarceration, argument with family or friend, or domestic violence
Source: San Francisco 2024 point-in-time count and report; San Francisco Performance Scorecards; “Listen: How access to safe, affordable housing improves outcomes for everyone,” Our America (Chan Zuckerberg Initiative), July 8, 2022; and On the Edge of Homelessness, Terner Center. Analysis by McKinsey & Company.
The homelessness crisis in San Francisco isn't just about numbers; it’s a deeply human challenge. Individuals, service providers, and the City face difficulties at every stage of the journey, but there are also opportunities for reform. This journey can be broken into three stages:
Entering homelessness
People entering homelessness usually come from extremely low-income households, earning less than 30% of the area’s median income. They may benefit from prevention services, like crisis support, rental assistance, and legal aid, to help them stay housed. Often, they are catapulted onto the streets or to the couch of a family member or friend because they lost a job or missed a rent payment. Homelessness is triggered by events such as job loss or eviction, and many of those who lose their homes have experienced homelessness before. People at risk of homelessness, like those already experiencing it, are disproportionately people of color, reflecting broader systemic inequities.
Experiencing homelessness
People experiencing homelessness live in shelters or places not meant for regular sleeping, such as cars or parks. They need a range of services, from basic necessities like food and hygiene services to more acute care such as healthcare and substance use treatment.
Exiting homelessness
People exit homelessness through various means, including entry into permanent housing or temporary situations, such as staying with family or friends. Sadly, others only escape because they migrate or, worse still, perish. Many reenter homelessness, especially if they are unreliably housed. For those who have experienced homelessness for over a year and face conditions that prevent them from maintaining work or housing, permanent supportive housing may be needed. Many spend a lifetime on the streets.
The system designed to support these individuals is extremely complex. Many people experiencing homelessness find the available services confusing and overwhelming. In San Francisco, more than 230 providers receive public funding to offer services, including healthcare, housing access, behavioral health, and social support. However, these services often overlap, resulting in a fragmented system where people may need to navigate as many as 15 to 30 service providers just to get the help they need.
This graphic demonstrates the interactions among individuals, service providers, and City agencies, highlighting the complexity of the system. The three stages of homelessness are depicted on the left. Between City agencies and funding bodies are more than 230 service providers that offer housing or support services. Unfortunately, these providers are often disconnected. They may even be funded by multiple City agencies, sometimes for the same programs. This creates inefficiencies, leaving people stuck in the system for longer than necessary.
The model is based on external research and includes assumptions that may not be entirely accurate, as they depend on uncertain factors and events. Future outcomes could vary significantly from the forecasts or estimates shown in the analysis.
Source: SF.gov; San Francisco Mayor’s Proposed Budget Books; San Francisco Controller’s Adopted Budget Reports; CalHHS; websites and reports from service providers. The analysis for this graphic was completed by McKinsey & Company.
[14] "Point-in-Time Counts," San Francisco Department of Homelessness and Supportive Housing.
[15] "2024 San Francisco Point-in-Time Count Report," San Francisco Department of Homelessness and Supportive Housing, 13 Aug. 2024, hsh.sfgov.org/wp-content/uploads/2024/08/2024-San-Francisco-Point-in-Time-Count-Report-8_13_24-1.pdf.
[16] “Racial Equity and Homelessness,” All Home, www.allhomeca.org/racial-equity-and-homelessness/, accessed 26 Sept. 2024.
[17] Statewide and national figures are based on 2023 point-in-time counts; San Francisco figures are based on 2024 point-in-time counts. "2023 Annual Homeless Assessment Report (AHAR) to Congress, Part 1: Estimates of Homelessness in the United States," U.S. Department of Housing and Urban Development, Dec. 2023, www.huduser.gov/portal/sites/default/files/pdf/2023-AHAR-Part-1.pdf.
[18] "2024 San Francisco Point-in-Time Count Report," Department of Homelessness and Supportive Housing; San Francisco City Performance Scorecards,
https://www.sf.gov/resource/2024/san-francisco-performance-scorecards; “Listen: How Access to Safe, Affordable Housing Improves Outcomes for Everyone,” Our America (Chan Zuckerberg Initiative), 8 July 2022,
https://chanzuckerberg.com/newsroom/listen-how-access-to-safe-affordable-housing-improves-outcomes-for-everyone/; Carolina Reid, On the Edge of Homelessness, Terner Center for Housing Innovation, UC Berkeley, Dec. 2021,
https://ternercenter.berkeley.edu/wp-content/uploads/2021/12/ELI-Households-Bay-Area-Report-Final-1.pdf.